Label ggplot2 axis according to temporal scale of gasflux
Source:R/ggplot_shortcuts.R
axis.flux.co2.RdLabel ggplot2 axis according to temporal scale of gasflux
axis.flux.co2(time)

axis.flux.gas(time)

axis.flux.ch4(time)
Arguments
| time | character; Either "sec" oder "day". See 'Details'. |
|---|
Value
Returns ylab object
Details
"sec" returns expression(## ~ flux ~ ("µ" ~ mol ~ m^-2 ~ s^-1))),
"day" returns expression(## ~ flux ~ (mmol ~ m^-2 ~ d^-1))),
where ## is either "Gas", "CO2", or "CH4"
Examples
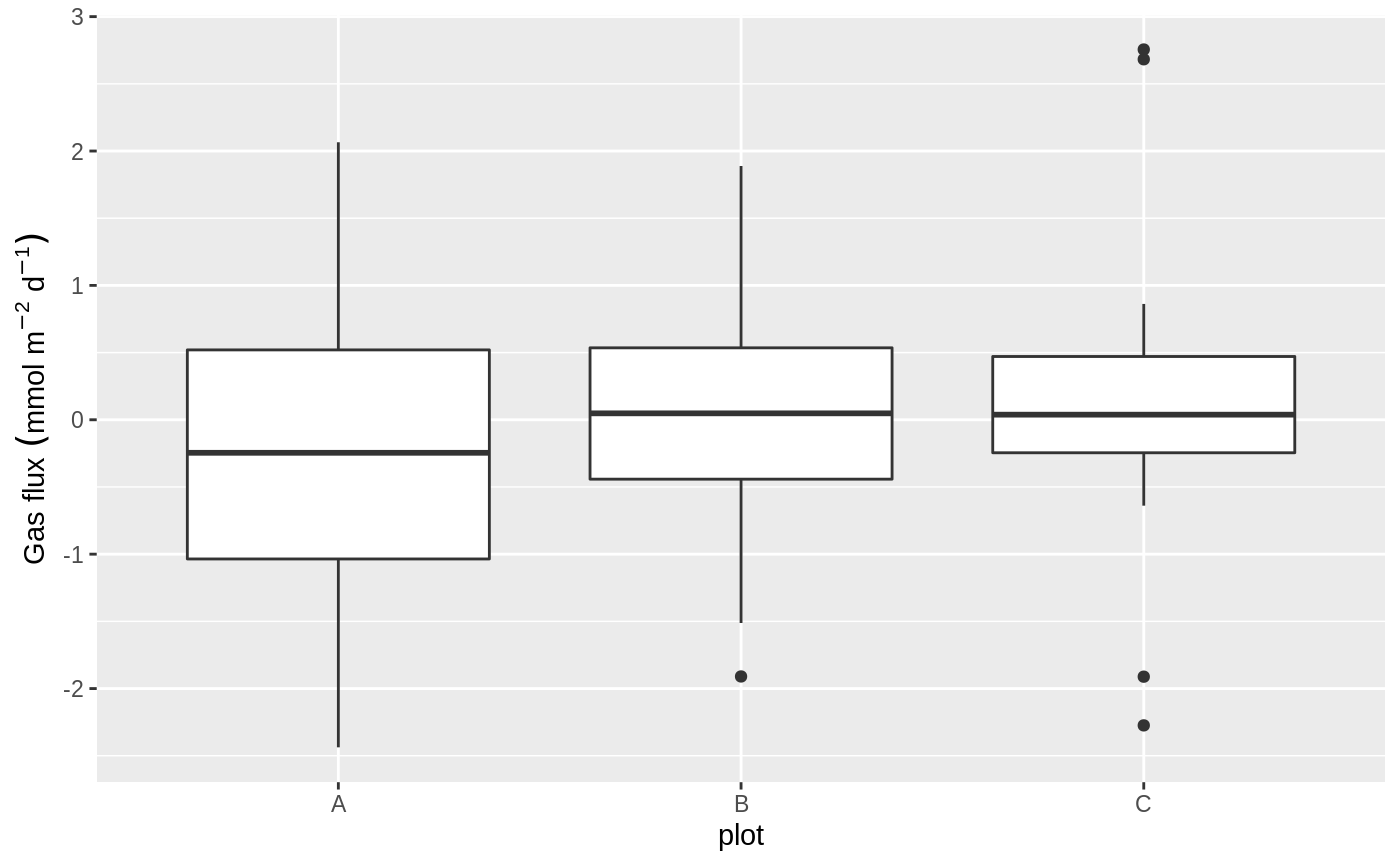
library(ggplot2)

df <- data.frame(
    plot = rep(c("A", "B", "C"), each = 20),
    flux = c(rnorm(20), rnorm(20), rnorm(20))
)

ggplot(df, aes(plot, flux))+
geom_boxplot()+
axis.flux.gas("day")